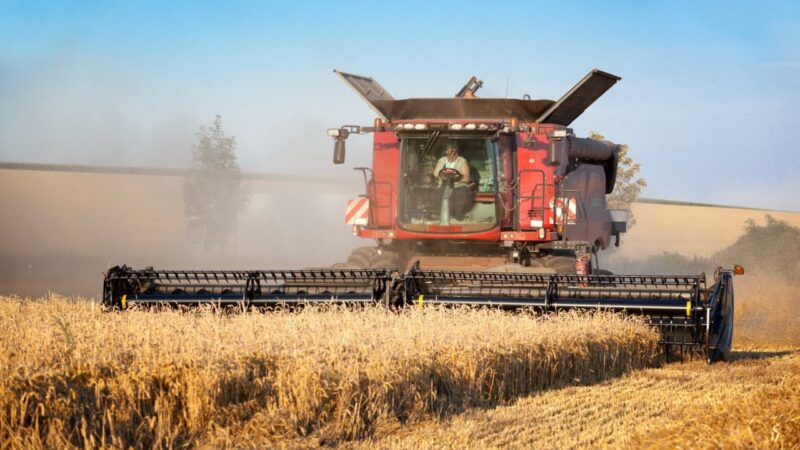
The USA is one of the developed countries with their highly productive mills and factories. They focus on a mixed economy particularly based on petroleum business. But the USA is also one of the largest agro based countries. Its agriculture contributes 0.6% in their yearly GDP.
Here you check all 50 US states ranked by agricultural production percentage.
Data of Agricultural Production by States
| 1. California | 11.8% |
| 2. Iowa | 8.0% |
| 3. Nebraska | 6.1% |
| 4. Texas | 5.7% |
| 5. Minnesota | 5.0% |
| 6. Illinois | 4.9% |
| 7. Kansas | 4.9% |
| 8. Indiana | 3.3% |
| 9. North Carolina | 3.1% |
| 10. Wisconsin | 2.9% |
| 11. Missouri | 2.8% |
| 12. South Dakota | 2.7% |
| 13. Washington | 2.5% |
| 14. Arkansas | 2.31% |
| 15. Ohio | 2.29% |
| 16. Georgia | 2.28% |
| 17. Idaho | 2.2% |
| 18. Florida | 2.07% |
| 19. Colorado | 2.02% |
| 20. Michigan | 2% |
| 21. North Dakota | 2% |
| 22. Oklahoma | 1.82% |
| 23. Pennsylvania | 1.8% |
| 24. Kentucky | 1.48% |
| 25. New York | 1.45% |
| 26. Alabama | 1.41% |
| 27. Mississippi | 1.41% |
| 28. Oregon | 1.37% |
| 29. Arizona | 1.36% |
| 30. Montana | 1.01% |
| 31. Tennessee | 0.93% |
| 32. Virginia | 0.91% |
| 33. New Mexico | 0.86% |
| 34. Louisiana | 0.82% |
| 35. South Carolina | 0.62% |
| 36. Maryland | 0.59% |
| 37. Utah | 0.49% |
| 38. Wyoming | 0.41% |
| 39. Delaware | 0.34% |
| 40. New Jersey | 0.31% |
| 41. Vermont | 0.21% |
| 42. Nevada | 0.21% |
| 43. Maine | 0.2% |
| 44. West Virginia | 0.2% |
| 45. Hawaii | 0.1% |
| 46. Connecticut | 0.1% |
| 47. Massachusetts | 0.1% |
| 48. New Hampshire | 0.00% |
| 49. Rhode Island | 0.00% |
| 50. Alaska | 0.00% |
Based on the total production of different states, you can understand the contributions of agriculture in their GDP. Their agriculture specialists are also working on increasing the production rate. Hence, the USA is capable enough to meet the internal demand of agriculture production every year.
Interested in more similar US data? Check out:

